
Intact MS from a Biologist’s Perspective
Matthew Crawford, MS
A question that arises frequently when discussing intact protein analysis by mass spectrometry (MS) is “why should we do mass spec analysis on intact proteins when we already have gel?†The short answer is that mass spectrometry, and its familiar coupling with liquid chromatography (LC- combined to make LC/MS), is an incredibly data-rich resource, especially when compared with gel separations. The goal of scientific workflows should always be to be the most efficient means of data acquisition and MS can provide just that, leading to the minimization or elimination of:
- Incomplete results – Results that cause more questions than they answer
- “Dead End Analysesâ€- Chasing results that do not efficiently set up the next process step
- Bottlenecks – Non-scalable processes
Over the next installments in this series of blog posts, we will be exploring the topic of intact protein analysis and diving deeper into its background, workflows, and importance of these analyses.
Starting off, it is critical to understand some of the shortcomings and pitfalls of traditional biological approaches, as well as the improvements in both data quality and process automation made possible by an LC/MS approach.
The typical workflow for protein generation and characterization is:
- Create a plasmid that contains the gene for the protein of interest (whether for mammalian or bacterial culture)
- – Often the gene has a tag sequence on it for downstream work (His tag, HA tag, Flag tag, etc.)
- Transfect that plasmid into the cells and grow them until they have the protein titer the biologists are looking for
- Lyse the cells (non-excreted) or collect cell supernatant (excreted)
- – Check by gel
- Perform a bulk capture (MWCO, affinity tag) of the protein
- – Check by gel
- Perform “polishing†clean-up of the protein
- – Check by gel
- – Check by activity assay of some sort
At the end of this workflow the scientists have a gel that shows their protein is the “right mass†and an activity assay that tells them how active the protein is. However, there will often be batch-to-batch activity variability and questions arise as to why the same protein is having such different activities. SEC (size-exclusion chromatography) is generally the next step taken, but that can also show just one peak in many instances as well, which would indicate that the gene is still correct, but something has changed about the protein.
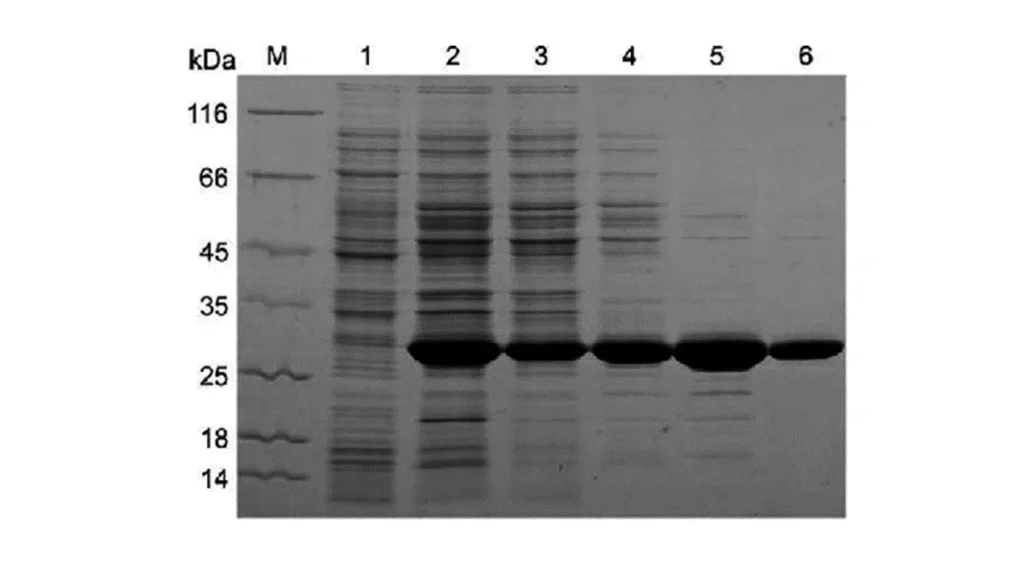
lane 2 is lysate of an engineered cell to make protein of interest, lanes 3 through 6 are different stages of
purification.
Gel and SEC both have a significantly lower resolution than MS meaning that relatively small size differences of proteins are not detected. This can be a consequential problem as post-translational modifications (PTMs) to proteins can often have a relatively small effect on size, so there will only be one peak on an SEC and one band on a get, but PTMs can have a huge impact on protein activity.
The same is true for cofactors, often they will not affect the size of a protein enough to be seen as a new band in a gel, but will be visible on MS.
The activity assay that is specific to the protein of interest is the final and undeniable best way to determine if the protein is the “right one.†Since the activity assay only targets one proteoform of one protein, it only tells you if the one proteoform is there that you want, but if the activity drops, it would indicate that the protein is not right, but you cannot say why!
Here is where MS (mass spectrometry) can really help to solve the problem.
Using a high-resolution MS (at Rilas we use Agilent’s 6545XT AdvanceBio LC/Q-TOF) very small mass changes are easily detected, even in larger proteins. The crux of this is a ratio of resolution. The high-res MS can see very tiny changes in relative mass even at high mass compounds (a couple Daltons even at >100 kDa), but a gel will not show much difference even from a 500 Dalton change at 40 kDa.
A few things that can change in a protein that would not necessarily show up on a gel but would on high-res MS:
- Differential gene splicing —> when a gene gets expressed as RNA, occasionally this gets modified prior to the protein getting made (this is monitored in certain -omics spaces), so there will be slight changes in the amino acid sequence that can be seen (large changes are commonly visible by gel or SEC, but small ones would not be)
- PTMs —> glycosylation, phosphorylation, ubiquitinoylation (may show up on gel depending on level of ubiquitinoylation and size of protein, but may not), covalent adduction with small inhibitors, non-covalent binding with small inhibitors or cofactors.
- Omics analysis —> certain PTMs rely on the presence of metabolites in the cell as reactants in protein modification; analysis of PTM rates can enable modelling of intracellular processes not visible by other methods
Below (Figures 2, 3 & 4) is an intact MS and a gel of Bovine Serum Albumin, theoretical MW = 66,400 Daltons.This mass has been confirmed by MS, but during analysis multiple modifications were identified that were not visible by gel.
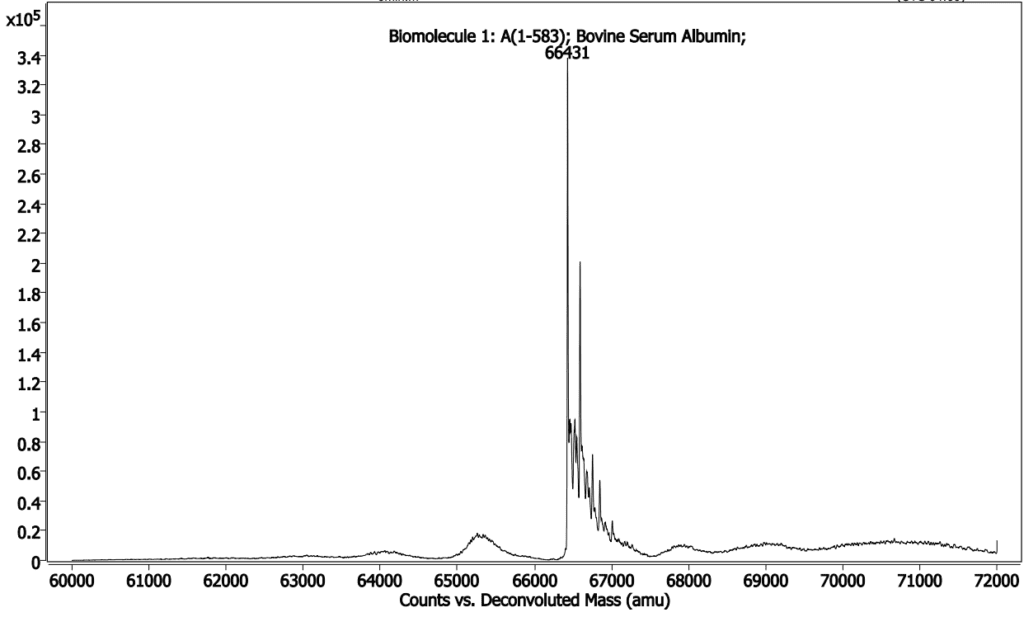
from BSA having one extra tyrosine (major peak is desired
mass, small peak to right of major peak is +Tyr mutant).
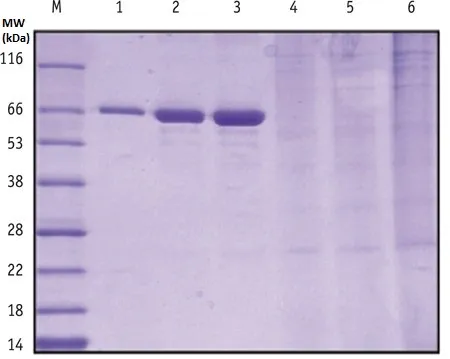
the tyrosine addition, nor infer exact molecular weight
shifts.
M is molecular weight ladder, lanes 1 through 3 are 0.25,
0.5, and 1 ug of BSA added to the gel, lanes 4 – 6 are cell
lysates containing trace amounts of engineered protein.
looks to be some dimerization occurring, but that’s all we
can say (definitely cannot see the Tyr addition as seen in
MS).
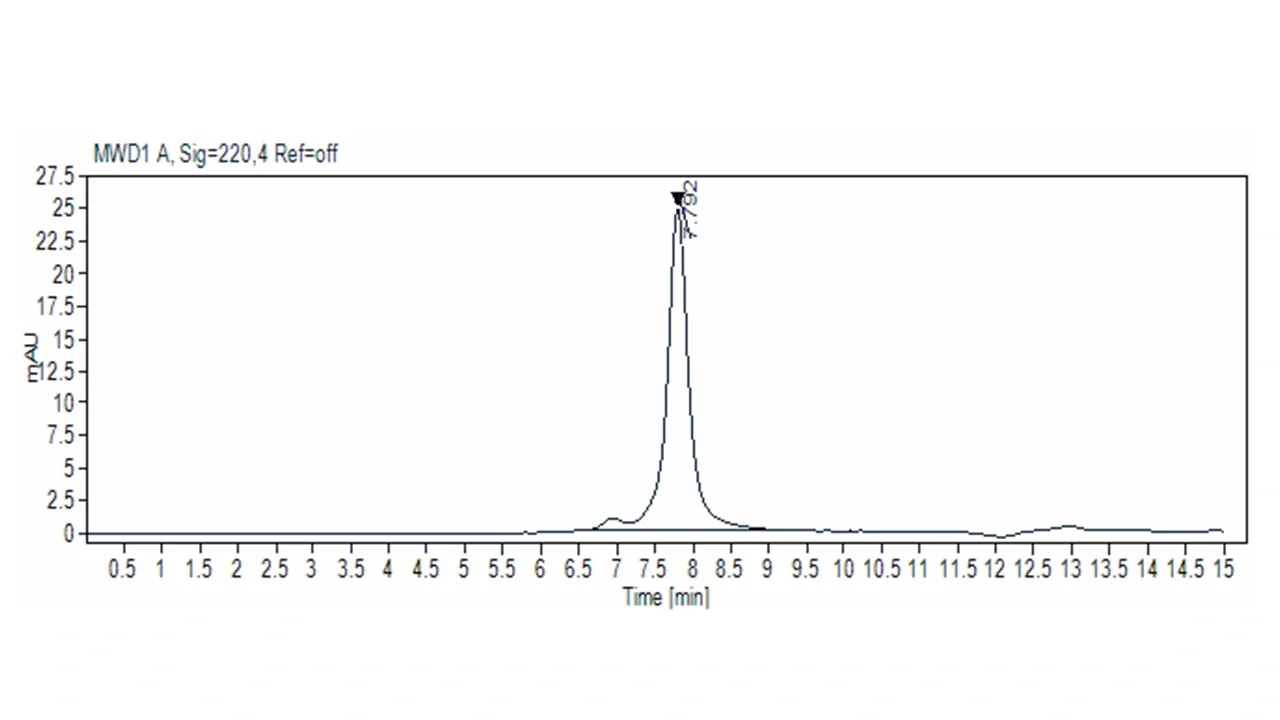
One important factor to keep in mind with MS is that MS is not specific and will tell you everything that is in the sample. Purification becomes an essential step (raw cell lysates have too many additional compounds in the sample to get usable data). Once the clean-up is completed though, a whole new level of insight into the protein is possible. The actual changes that are happening to the protein are visible by high-res MS that cannot be detected even in the activity assay such as: did it get glycosylated, did it get phosphorylated, did it break down, what specifically happened?
Unlocking the potential of the powerful features of our qTOF has been a major accomplishment of Rilas and weare eager to share more of our knowledge. The methods we use for protein purification, cleanup, and PTM analysis will be covered in future blog posts as well as many other topics, so stay tuned!